You can download a pdf version of this page by clicking HERE
Chapter 3 – Biodiversity
3.1 Introduction
This chapter covers the broad topic of biodiversity and because of the complexity of issues, is a very long chapter. Biodiversity is the ‘green’ component of the environment referred to in Chapter 1. First biodiversity is defined (3.2), and then the values of flora and fauna are set out including an argument as to why conserving for a biodiverse planet is essential (3.3). The often complex relationship between humans and nature is then discussed (3.4), followed by a discussion of the current biodiversity crisis including the key threats to biodiversity conservation (3.5). The chapter then turns to two discussions of the policy and planning context for biodiversity first with an overview of the situation at the national level (3.6) then a detailed discussion of how policy implementation in the Western Australian context (3.7, 3.8, 3.9 and 3.10). The next section returns to the national level discussing one particular aspect of the Commonwealth’s legislation on biodiversity protection impacts at the state level (3.11). The next section discusses the most recent biodiversity policy for Perth and Peel – the ‘Green Growth Plan’ (3.12) – which is followed by a discussion of legislation and regulations introduced in WA to control the clearing of remnant native vegetation in WA, including a brief history (3.13). The final section is a discussion of the contentions issue of biodiversity offsets (3.14).
3.2 What does ‘Biodiversity’ mean
The Australian Commonwealth Government defined biodiversity as:
Biodiversity, or biological diversity, is the variety of all life forms on earth; it is the different plants, animals and micro-organisms; their genes; and the terrestrial, marine and freshwater ecosystems of which they are a part. (National Biodiversity Strategy Review Task Group 2009){National Biodiversity Strategy Review Task Group, 2009 #1268;National Biodiversity Strategy Review Task Group, 2009 #1268}
And there is great variety of life on earth. In Australia alone, there is an estimated 680,000 different species of plants and animals of which only around 172,000 have actually been fully described (Australian Government 2009).
Biodiversity is not a static thing. Natural evolutionary processes cause natural changes through cyclic climate changes and changing habitat caused by natural forces (acute events like volcanoes and chronic changes like erosion). These changes can cause habitat degradation, population decline, and eventually extinction. As well, natural processes bring about the formation of new species.
The need to conserve our biodiversity has become both an international and a national concern. Australia is one of 194 nations to sign the Convention on Biological Diversity, which was initiated in 1992 as part of the Rio Earth summit, coming into force in 1993. The Convention requires that signatory nations develop national strategies “for the conservation and sustainable use of biological diversity” (Article 6 of the Convention).
Australia has national biodiversity protection legislation – the Environment Protection and Biodiversity Conservation Act 1999 – with 8 broad objectives, one of which is “to promote the conservation of biodiversity” (Object c). In 2010 the Commonwealth released the updated National Biodiversity Conservation Strategy (Natural Resource Management Ministerial Council 2010). The strategy has a “Call for Action” which is:
Australia’s biodiversity … is in decline. Conservation efforts over past decades have resulted in improvements in some areas. Overall, however, the extent and condition of many species and ecosystems continue to deteriorate.
The pressures affecting Australia’s biodiversity are not unique. Many scientists consider that the Earth has now entered a global biodiversity extinction crisis (UNEP 2007). Unlike past mass extinctions, the current crisis is considered to be the culmination of human impacts on the environment over the last several thousand years. (P17)
Planning will have an important role in conserving our biodiversity. As Beatley notes:
Long-range land use planning must be the linchpin of our new biodiversity conservation strategies. Increasingly, this challenge must be faced by planners … (Beatley 2000, , 7)
Before describing the role of planning in biodiversity conservation, its first important to set out the reasons why biodiversity conservation is important.
3.3 The values of native flora and fauna, and the importance of protecting biodiversity
There are a number of important reasons why we should protect native flora and fauna, many of which are about human self-interest: that is, they provide benefits to humans. The reasons described here are drawn from several sources (Department of Conservation and Land Management 2004; Natural Resource Management Ministerial Council 2010; Secretariat of the Convention on Biological Diversity 2010; WWF, Zoological Society of London and Global Footprint Network 2010).
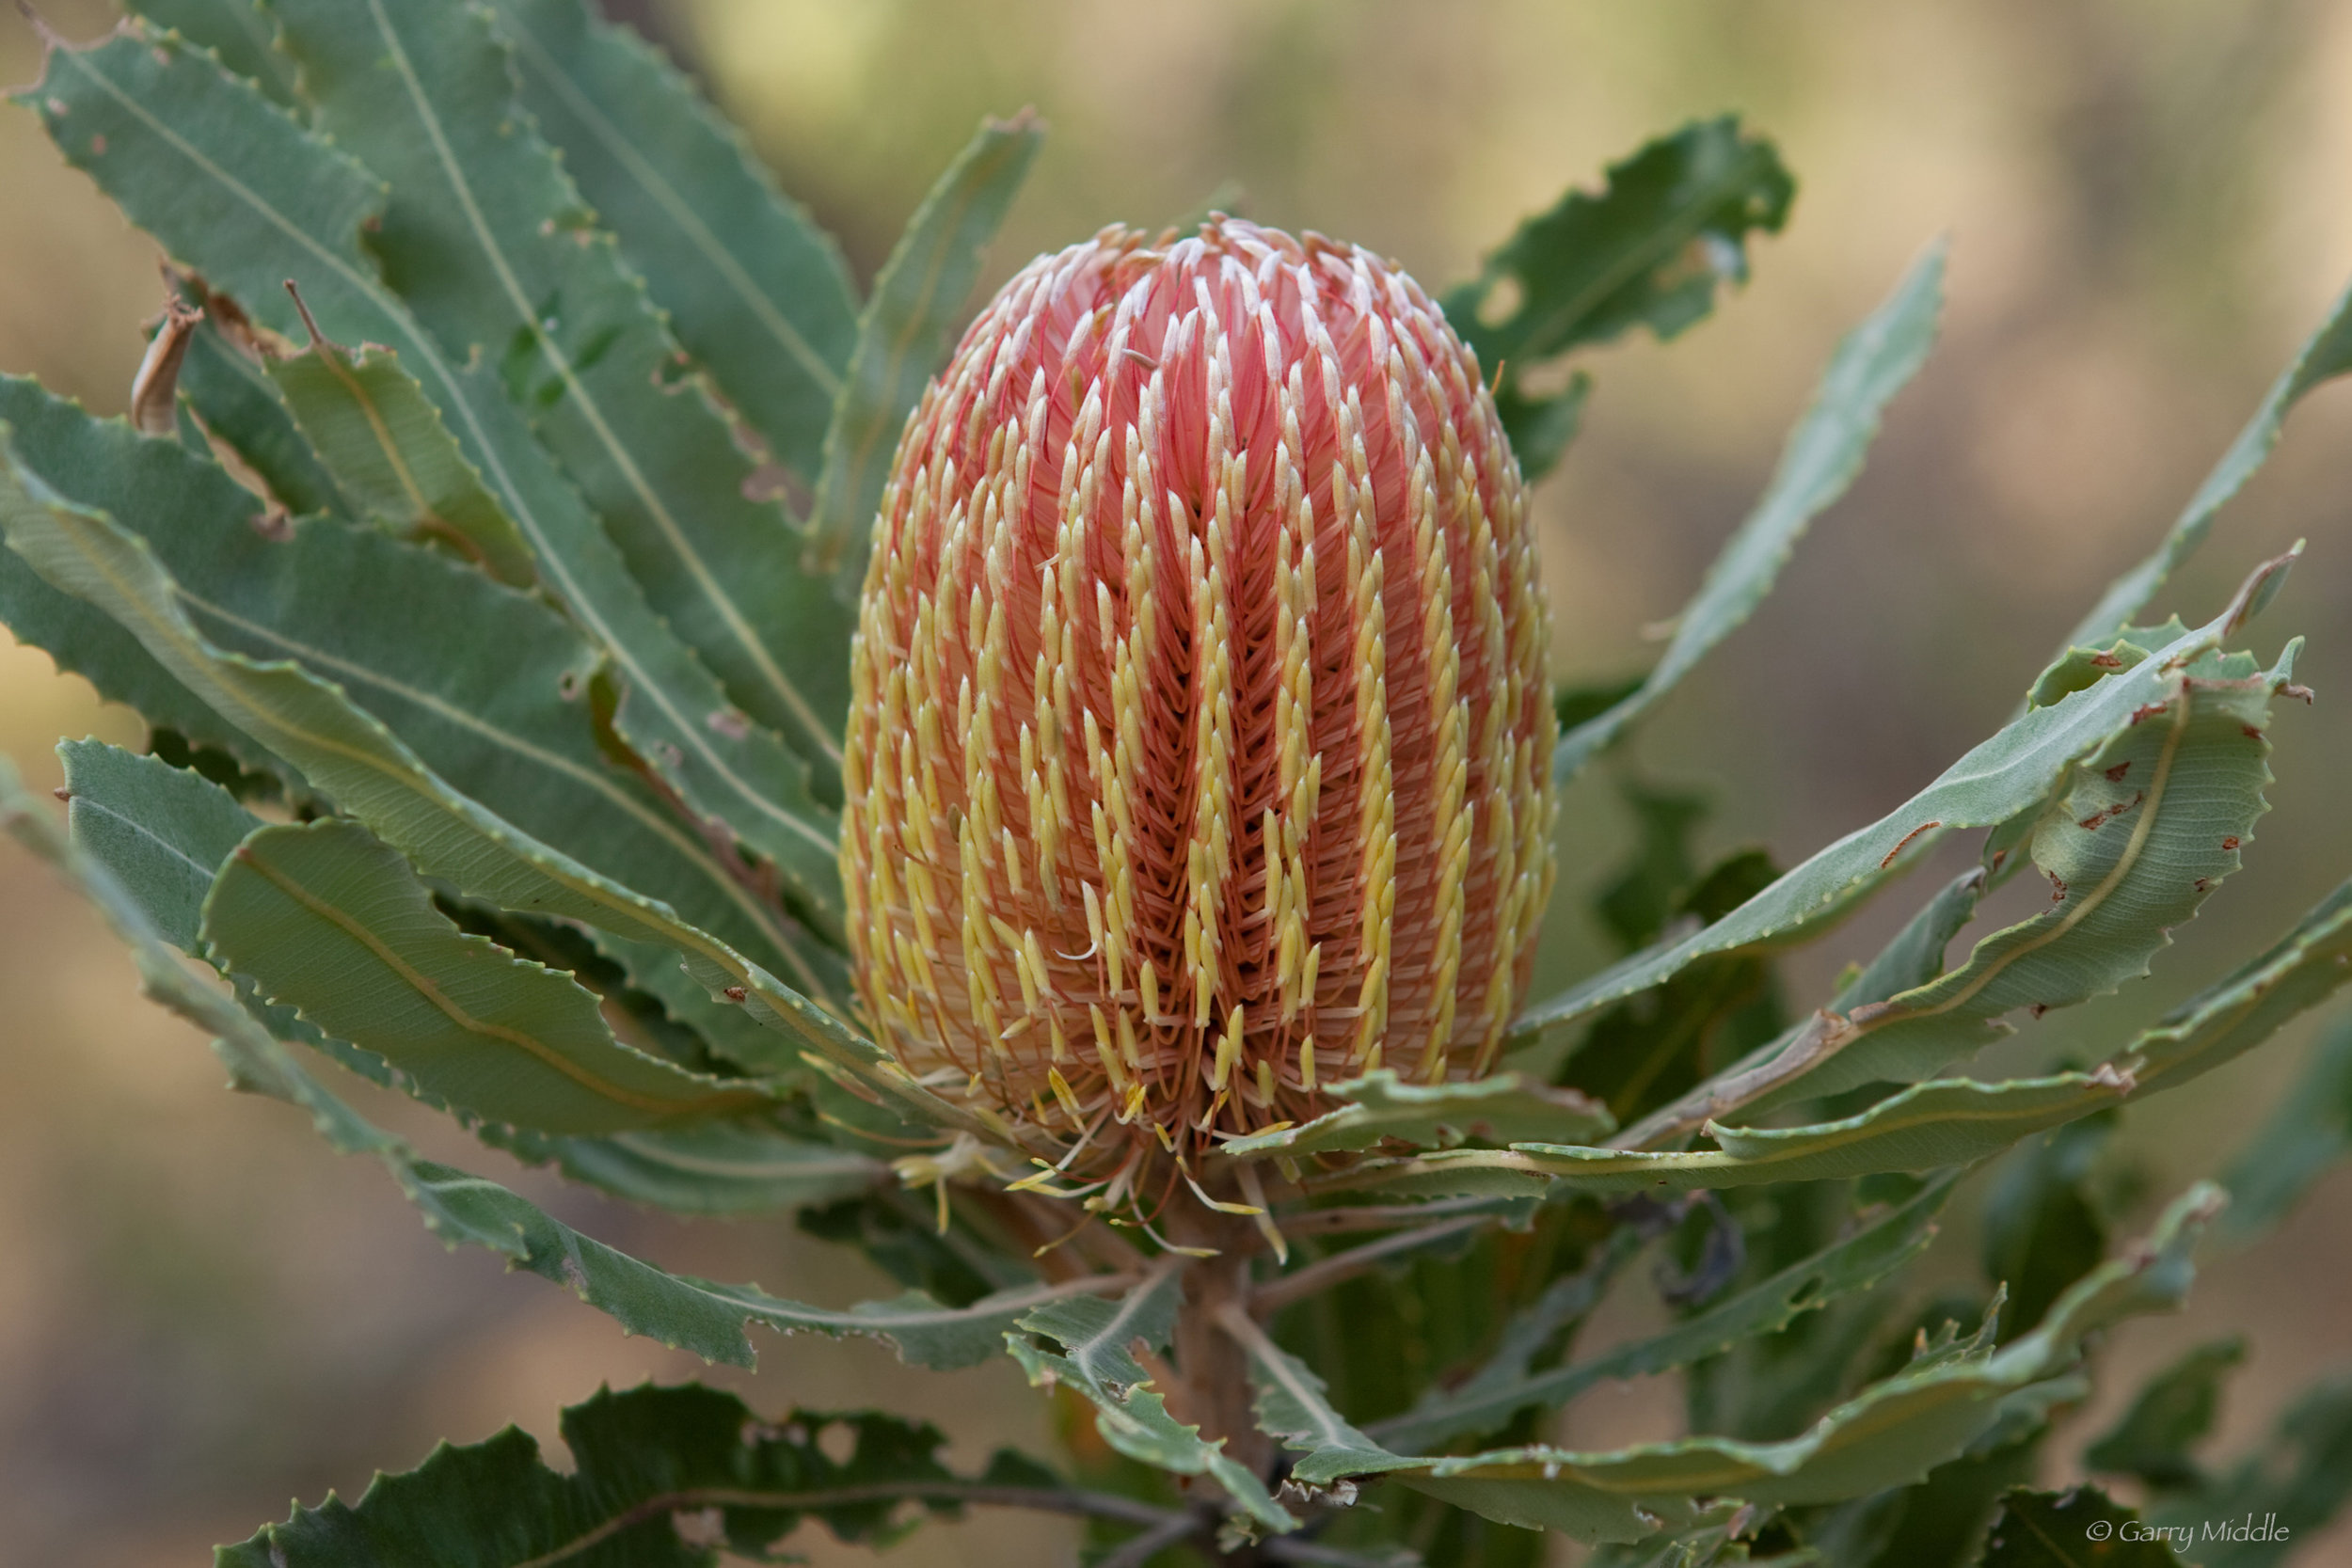
Native flora and fauna provide direct economic production, for example wildflowers for commercial sale (Plate 3.1). Forests provide wood as a fuel for heating and cooking (especially in developing countries) and products for shelter and building materials, fine woodcraft, paper. As well, many of our medicines have been derived from native species, for example penicillin. There are also the indirect economic benefits, notably recreation in our national parks (Plate 3.2). Some species provide natural control of pests through predation, whilst other species pollinate commercial crops.
Plate 3.1: Banksia menziesii flower, often used by florists in WA
Eco-tourism, or nature-based tourism, is an important and growing part of the world tourism industry (Priskin 2001). Whilst tourism as a whole grows annually at around 4%, nature-based tourism grows at between 10-30% (Yıldırım, Tutku and Zuhal 2008). The Australian Department of Resources, Energy and Tourism estimated that 64% of all international visitors participated in some form of nature-based activity (Toursim Research Australia 2009).
There are also what are called ‘ecosystem services’, which are the broader processes that are essential for the stability of the globe as a whole, and add to our quality of our lives. Notably:
- Oxygen production;
- Capturing and storing carbon (removal of carbon dioxide from the atmosphere), which stabilizes and moderates the Earth's climate by controlling global temperatures;
- Cleaning the air and water of toxic chemicals;
- Increasing rainfall;
- Flood mitigation (mangroves, and coastal wetlands);
- Generation and renewal of soil fertility, including nutrient cycling; and
- Detoxification and decomposition of waste.
Plate 3.2: Bushwalking in Hartz Mountains National Park, Tasmania

These are compelling arguments about protecting native flora and fauna, especially flora. It could, however, be argued that all of these services could be provided by highly manicured ecosystems made up of key species recognised as being of most value. These are not arguments for the protection of existing natural areas and to protect the full range of diversity in nature (biodiversity). The arguments about protecting biodiversity are a little less tangible.
First, there is the ‘unknown unknown’ issue – there is so much or our natural environment that we don’t understand. For example, it is highly likely that there are species of plants yet to be discovered that will be powerful medicines or important food sources. Consequently, we should plan for protecting biodiversity rather than just protecting flora and fauna: karris forest rather than karri plantations (Plates 3.3 and 3.4). Natural areas act as control sites to compare development impacts. In a sense, if these areas are lost, we don’t know the full extent of what we would have actually lost.
Second, biodiverse areas provide for a range of social values that single species plantations can not, including:
- More enjoyable recreation experiences, including the sense of wilderness;
- Spiritual/philosophical values; and
- Amenity – biodiverse areas have more natural beauty than single species plantations.
Third, a biodiverse planet is much more stable than one that is dominated by only a few species. The Irish potato famine of the mid 1800s (1845-52) serves as a warning in this regard. At the time, Ireland was highly dependent on the potato as both a source of food for humans and for livestock. There were only a few species of potato grown. In the early 1840s a type of fungus arrived in Ireland (Phytophthora infestans), commonly called ‘blight’, which attacked the potato fields and spread very quickly, wiping out most of the crops. The dependence on a single food type, and on only a few species of that type, meant that millions of people had no food and no alternative crop for several years. As well, in a natural biodiverse landscape a natural predator to the blight is more likely to have been present which may have minimised the loss of potatoes crops. Around a million people died and another million people left Ireland leading to a reduction in the population of around 25%. This catastrophe would have been avoided, or at least, significantly reduced, had a more biodiverse approach been adopted to agriculture.
Plates 3.3 and 3.4: A natural Karri forest compared to a Karri plantation


Fourth, natural ecosystems are more likely to deal with extreme weather events and other natural changes than non-biodiverse and highly modified ecosystems, and, therefore, natural ecosystem offers better protection against these events. For example, mangroves and coastal ecosystems are excellent at reducing the impacts of storms, cyclones and the resultant floods. The loss of these ecosystems in Florida exacerbated the floods that accompanied hurricane Katrina in 2005.
Finally, there is also an ethical reason why we should protect biodiversity – we share this planet with other species and they all have equal rights to survive as do we. Humans, as the most knowledgeable species, the one with biggest impacts, and the species that is most aware of its impacts, have a responsibility to protect all other species.
3.4 Human’s relationship to nature
A debate that often accompanies a discussion of biodiversity and its protection is the nature of humans’ relationship with nature. It’s important to see that relationship in its historic context. Humans have always used and exploited the resources that nature has provided. The Neolithic villages of around 11,000 years ago were the first to produce and use basic tools and implements, including baskets, pots, metal tools and weapons, and to domestic animals for work and transportation (Register 2006, , 75). This dependence on natural resources continued to grow and human civilisation evolved and became more sophisticated. Koshin (2011, , 6) argues humans have a strong history of, so-called, land improvement to increase the efficiency of agriculture by draining and reclaiming coastal swamplands which lead to a point around the 15th century where humans became “a controller, not just a user, of nature.”
Even with this change, humans and nature were still strongly linked, in that people’s lives were still linked to the natural seasonal cycle and the mode of production was still very much on an individual basis. This meant that humans still had to work directly with nature, even if it meant exploiting it. The arrival of industrialisation in the mid 1700s in Great Britain was the start of a significant change in how humans perceived and exploit nature. Firstly, the rate of exploitation increased dramatically. As Hawken et al. (1999, , 2) note “since the mid eighteenth century, more of nature has been destroyed than in all prior history.” As well, the mode of production and the emergence of large cities to provide the work force for the industrial factories meant that humans became more and more separated from dealing directly with nature. This lead to an emerging view that humans are separate from, and superior to, nature and that nature is a resource for us to use for our own purposes – called anthropocentricism. As Kopinanotes:
Anthropocentric thought, be it self-interest or altruistic humanism (caring for other people), not only entails human moral superiority vis-a`-vis other species, but also ethical consideration is exclusively confined to human beings.
The rise of the environmental movement in the 1960s and 1970s lead many people to rethink the value of industrialisation and our views about and relationship with nature and ecology. Modern environmentalism grew out of concerns about the environmental impacts of industrial development. At first, the environmental movement was mostly concerned about the pollution and resource depletion and the impacts on human health and well-being. This has been called “shallow ecology” (1999, , 2). Later, the deep ecology movement emerged which
... concerns itself, first, with an expanded view of the human/non-human community, where humans and non-human life are inseparably related to one another; and second, with the realization that all life has an equal right to “live and blossom”. (Grano 2002)
These three views – anthropocentricism, shallow ecology and deep ecology – represent the full spectrum of views in the community about our relationship with nature.
3.5 A Biodiversity crisis?
Notwithstanding this debate, there is now an urgent need for action to better protect and plan for biodiversity. 2010 was declared by the United Nations (UN) as the international year of biodiversity as a way of raising awareness about the global loss of species and habitats. Below is a sample of the data on biodiversity loss taken from one of the UN reports released in 2010 (Grano 2002, , 27) and from the Worldwatch Institutes Vital Signs website (http://vitalsigns.worldwatch.org/ ) .
- 36% of all species evaluated by the International Union for Conservation of Nature (IUCN) are considered to be threaten with extinction;
- 30% of amphibians, 21% of mammals, and 12% of bird species are listed as threatened with extinction;
- Of the 1,200 waterbird populations being monitored, 44% are in decline; and
- Logging or land clearing in tropical forests is threatening over 60% of amphibian species in the world.
Conservation International (a world-wide conservation NGO) has identified 34 global biodiversity hotspots (rich in biodiversity but having over 70% of the natural vegetation cleared) and the SW of WA is on of those hotspots - http://www.conservation.org/where/priority_areas/hotspots/Pages/hotspots_main.aspx . At a more local level, 8 of the 15 national biodiversity hotspots are in WA.
Biodiversity in Agriculture is of concern. In the United States, only 10% of varieties of crops registered in a 1904 inventory are still grown or stored. In China has lost nearly 90 % of its traditional wheat varieties since World War II.
The United Nations Environment Programme (UNEP) identify five key global threat to biodiversity:
- Habitat change,
- Overexploitation
- Pollution,
- Invasive alien species, and
- Climate change.
At the national level, the key threat to biodiversity are (Secretariat of the Convention on Biological Diversity 2010):
- Climate change,
- prolonged drought
- changing rainfall patterns
- ocean warming (Coral bleaching);
- Invasive species (weeds and pests);
- Loss, fragmentation and degradation of habitat;
- Unsustainable use of natural resources;
- Changes to the aquatic environment and water flows; and
- Inappropriate fire regimes.
These pressures will increase in the future due to a rapidly growing populations in our major urban areas. In short, biodiversity planning in WA has never been more important as it is now.
3.6 Australia’s biodiversity
Australia has been an island for over 20 million years and is biologically separate from other parts of the world. Australia has between 600 000 and 700 000 species (25% of which are known), many of which are found nowhere else in the world. For example, 84% of plant species, 83% of mammal species, and 45% of bird species are only found in Australia (National Biodiversity Strategy Review Task Group 2009).
A key issue for biodiversity planning are the known unknowns: At least 75 % of our native species remain undiscovered or undescribed, and 45% of Australia’s land mass has not been fully biologically surveyed (Plate 3.5). This is a particular issues for the resources industry as exploration often occurs in this 45% un-surveyed part of Australia and it is not uncommon that new species are discovered as part of survey work in support of these proposals.
As noted above, Australia has signed up to a number of international treaties that address biodiversity protection, and the planning system needs to take these into account, in particular:
- World Heritage areas – for example, Shark Bay in WA; and
- Treaties to protect migratory species, notably the Ramsar treaty that protect s important wetland habitats for migratory waterbirds.
These sites, and the land adjacent to them, are highly constrained to development. Development within Wold Heritage areas should lead to no direct loss of habitat, and be sympathetic to values of the area. Ramsar sites are generally protected from development of any kind, and the surrounding land and catchment are often highly constrained. For example, development within catchments of Ramsar wetlands needs to ensure that nutrient and pollutants do not drain into the wetlands. As well, bird disturbance needs to be minimised. Noisy developments like airports are highly constrained near these sites (e.g. Broome and Busselton).
Plate 3.5: Eucalyptus articulata – known only in two remote and small locations in the Great Victoria Desert

3.7 Planning for biodiversity – a focus on Western Australia
Biodiversity need to be considered at three levels:
- Ecosystem diversity, which is the variety of habitats, biotic communities and ecological processes;
- Species diversity, which is the variety of species on earth (plants, animals, bacteria etc); and
- Genetic diversity, which is the variety of genetic information within and between populations of species.
Biodiversity is not a static thing. Natural evolutionary processes cause natural changes through cyclic climate changes, changing habitat caused by natural forces (acute events like volcanoes and chronic changes like erosion). These changes can cause habitat degradation, population decline, and eventually extinction. As well, natural processes bring about the formation of new species.
Humans cause these natural events to speed or can cause wholesale loss of habitat in a very quick time. Humans can also introduce new vectors not previously experienced, for example, new toxins synthetically produced, and human induced climate change.
Because change is a natural process, when we plan to protect our biodiversity we use the word “conservation” rather than “preservation”. “Preservation” implies that we would manage a natural area so that is does not change, not matter what happens to the climate. Such an outcome would be both expense and likely to fail. Instead, “conservation” is about managing an area to reduce any threats, but to also allow natural processes to take their course.
Dealing with the conservation of a single species threatened with extinction is a more difficult issue, and solutions can be a costly. This is because species that are vulnerable to extinction usually have specific and specialist habitats, nesting requirements or food requirements, and they are not adaptable to changes to any of these. Consequently, when their specific habitats are threatened through, for example, over clearing, their numbers decline rapidly. Recovering these lost habitats can be both costly and technically difficult. On the other hand, those species that readily adapt to human induced changes can be so successful that they become pests – for example mice, rats and the cane toad.
There are two key issues in conservation planning:
- Deciding on the broad ecosystem types are to be represented in a conservation system, and
- Selecting how much of each ecosystem type to conserve.
The first element is about having a representative conservation reserve system and generally works at the ecosystem or complex level.
3.8 Defining complexes – the Swan Coastal Plain as a case study
The vegetation in a specific location is broadly influenced by three factors:
- Soil and landform;
- Climate (mostly rainfall);
- Depth to groundwater or proximity to surface water.
Different soils have different levels of nutrients – the sands of the Swan Coastal Plain contain fewer nutrients compared to loamy and clay soils. The landforms as described in chapter 2 form the basis of the main vegetation complexes of the Swan Coastal Plain, with some variations, as explained below.
Referring back to chapter 2, the four main landforms of the Swan Coastal Plain are:
- The Quindalup dunes - these are very exposed to weather as they are at the coast. The vegetation tends to be low lying with few trees (bushes, shrubs and grasses). There are also evaluated levels of salt and calcium carbonate in the soils which impact on what grows there.
- The Spearwood dunes – the soils here are generally further away from the coast, are richer in nutrients than both Quindalup and Bassendean, and, where the soil is deep enough, support woodlands and forests. This land form in underlain with Tamala limestone, which can be at or near the surface to the west of the landform
- The Bassendean landform – is also well away from the coast, and the soils have few nutrients (gutless) than the Spearwood landform. Trees are found on this landform, but occur as woodlands (lower and less dense than forests) rather than forests; and
- The Pinjarra plain – is the flat landform on the east part of the Swan Coastal Plain. The soils are a mix of clay and sand, and hold water at the surface during most of the winter months and so will not generally support trees. Instead, the vegetation tends to be thick bushes and shrubs – i.e. wetland species.
The first variation is depth of soil, notably in the Spearwood landform. Some soils on the Spearwood landform have limestone at or near the surface and the soils are very shallow in depth. This makes it hard for roots to establish themselves, and these soils rarely support taller trees. This is called the Cottesloe complex and is primary found on the western part of the landform. The deeper soils found to the east of the Spearwood landform are not so constrained and will support taller forests. This is known as the Karrakatta complex.
Both rainfall and temperature are also important in determining vegetation structure. Trees in the dryer wheatbelt are much lower (mallees) than in the wetter and cooler south west of the State. On the Swan Coastal Plain, the vegetation on a particular landform near Jurien Bay will have quite different vegetation from the same landform found near Bunbury, primarily because the climate of Jurien Bay is both warmer and dryer than Bunbury.
Depth to groundwater is also significant. Where the groundwater is at or near the surface on the Swan Coastal Plain, the vegetation changes from upland to wetland vegetation in a matter of metres.
In 1980, the then Department of Conservation and the Environment published an “Atlas of the Natural Resources Darling System Western Australia”(Department of Environment and Conservation 1980), which described and mapped the natural environment of the Swan Coastal Plain and Darling Scarp and Plateau of the near Perth region. Chapter 2 of the Atlas described the landforms (Churchward and McArthur 1980), and the Swan Coastal Plain landforms described in Chapter 2 of this book are the same landforms describe in the Atlas. Chapter 3 of the Atlas (Heddle, Loneragan and Havell 1980) describes the vegetation complexes, are still used by today. They are based on the landforms described in Chapter 2 of the Atlas.
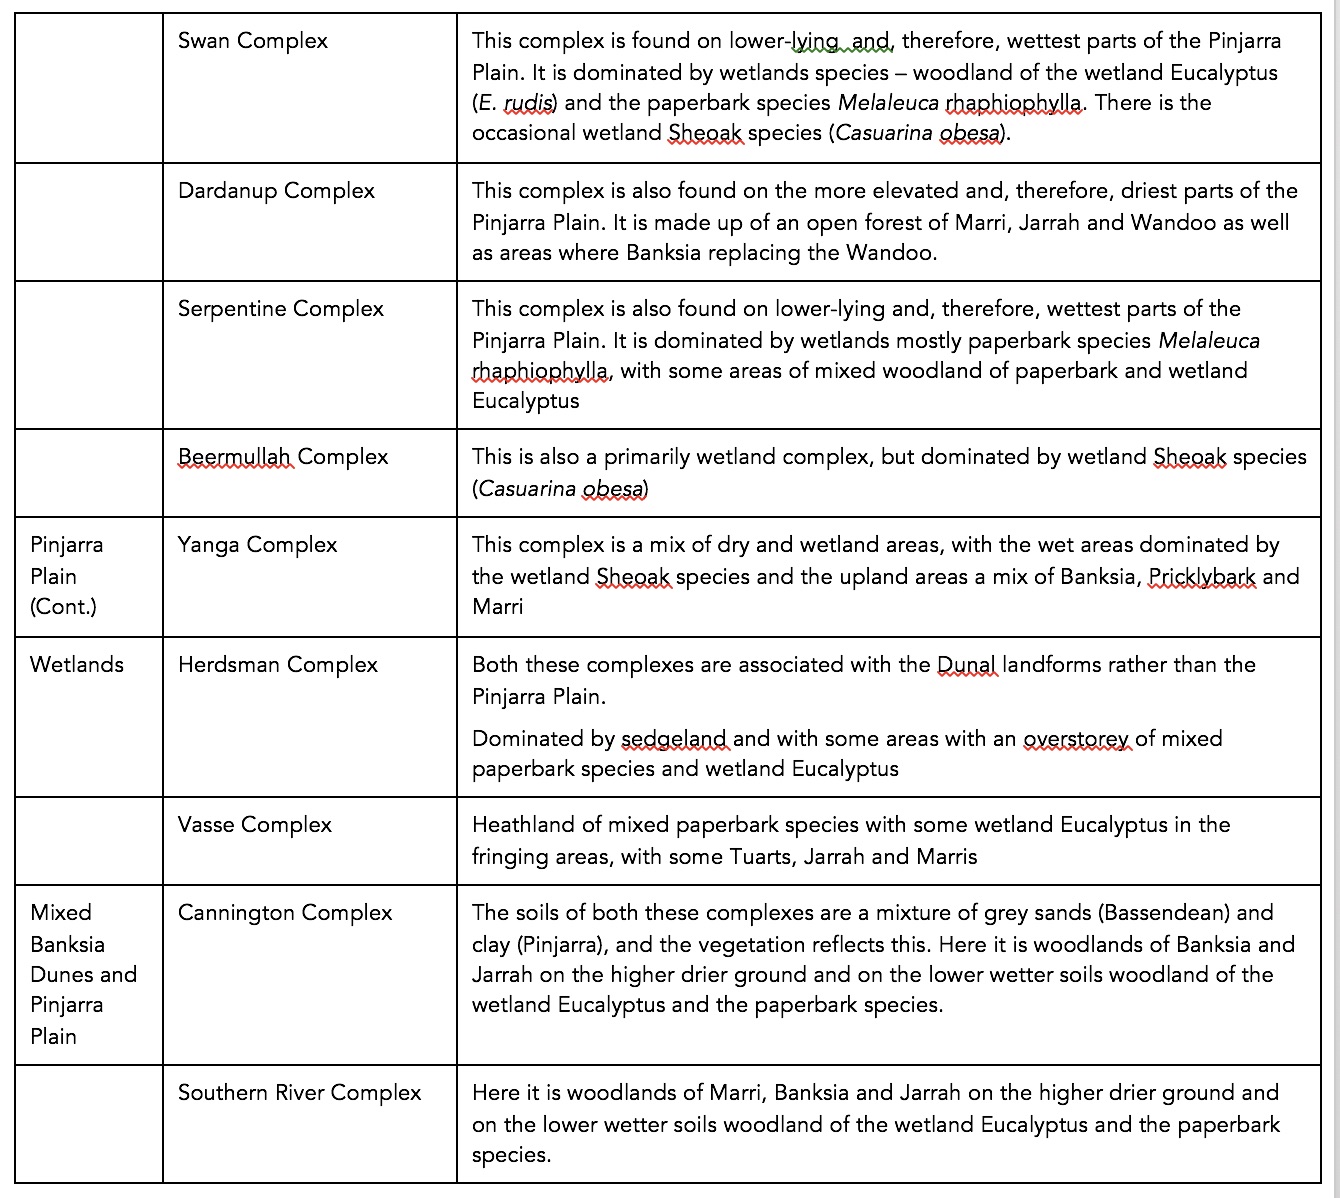
Table 3.1 below summarises the complexes grouped by Swan Coastal Plain landform and summarises the information in Heddle et al (1980). The brief vegetation description in the third column used the following physical descriptors of the appearance of the vegetation:
- Shurbland – vegetation dominated by woody bushes and ground covering plants with no trees (Plate 3.6);
- Heathland – shurbland dominated by woody bushes, which is mostly very thick and nearly impenetrable (Plate 3.7);
- Woodland – vegetation dominated by trees low in density so that plenty of sunlight reaches the woodland floor – i.e. limited shade (Plate 3.8).
- Forest - vegetation dominated by trees (which are generally, but not always, taller than woodlands) that are at a density such that the tree canopies tend to overlap preventing most of the sunlight reaching the forest floor – i.e. extensive shade (Plate 3.9); and
- Sedgelands – primarily found in wetlands and are composed of non woody but leafy herb species like sedges, rushes and grasses (Plate 3.10)
Plate 3.6: Typical shrubland, showing the mixture of bushes and herbs, including grasses and groundcovers

Plate 3.7: A typical Heathland in the Porongurups WA, showing the near impenetrability of the vegetation

Plate 3.8: A typical woodland showing the open canopy and limited shadowing

Plate 3.9: A typical forest showing the extensive canopy over and limited light penetration

Plate 3.10: Typical wetland sedgeland

The brief vegetation description is simply that – brief. Generally, plant species names are not included, other than familiar names of trees species. Where species names have been included, they are commonly or easily recognised species. Table 3.2 is a more user-friendly version of Table 3.1 where the number of complexes have been reduced by combining similar complexes.
Table 3.1: Vegetation complexes of the Swan Coastal Plain.

As can be seen, there are 20 different complexes, but the non-expert would probably conclude that some are only slightly different from others. Table 3.2 below is a simplified version that the non-expert would more easily recognise.
Table 3.2: A simplified description of the vegetation complexes of the Swan Coastal Plain.

Plate 3.11: Quindalup complex

Plate 3.12: Karrakatta Complexes

Plate 3.13: Cottesloe Complexes (limestone at the surface visible)
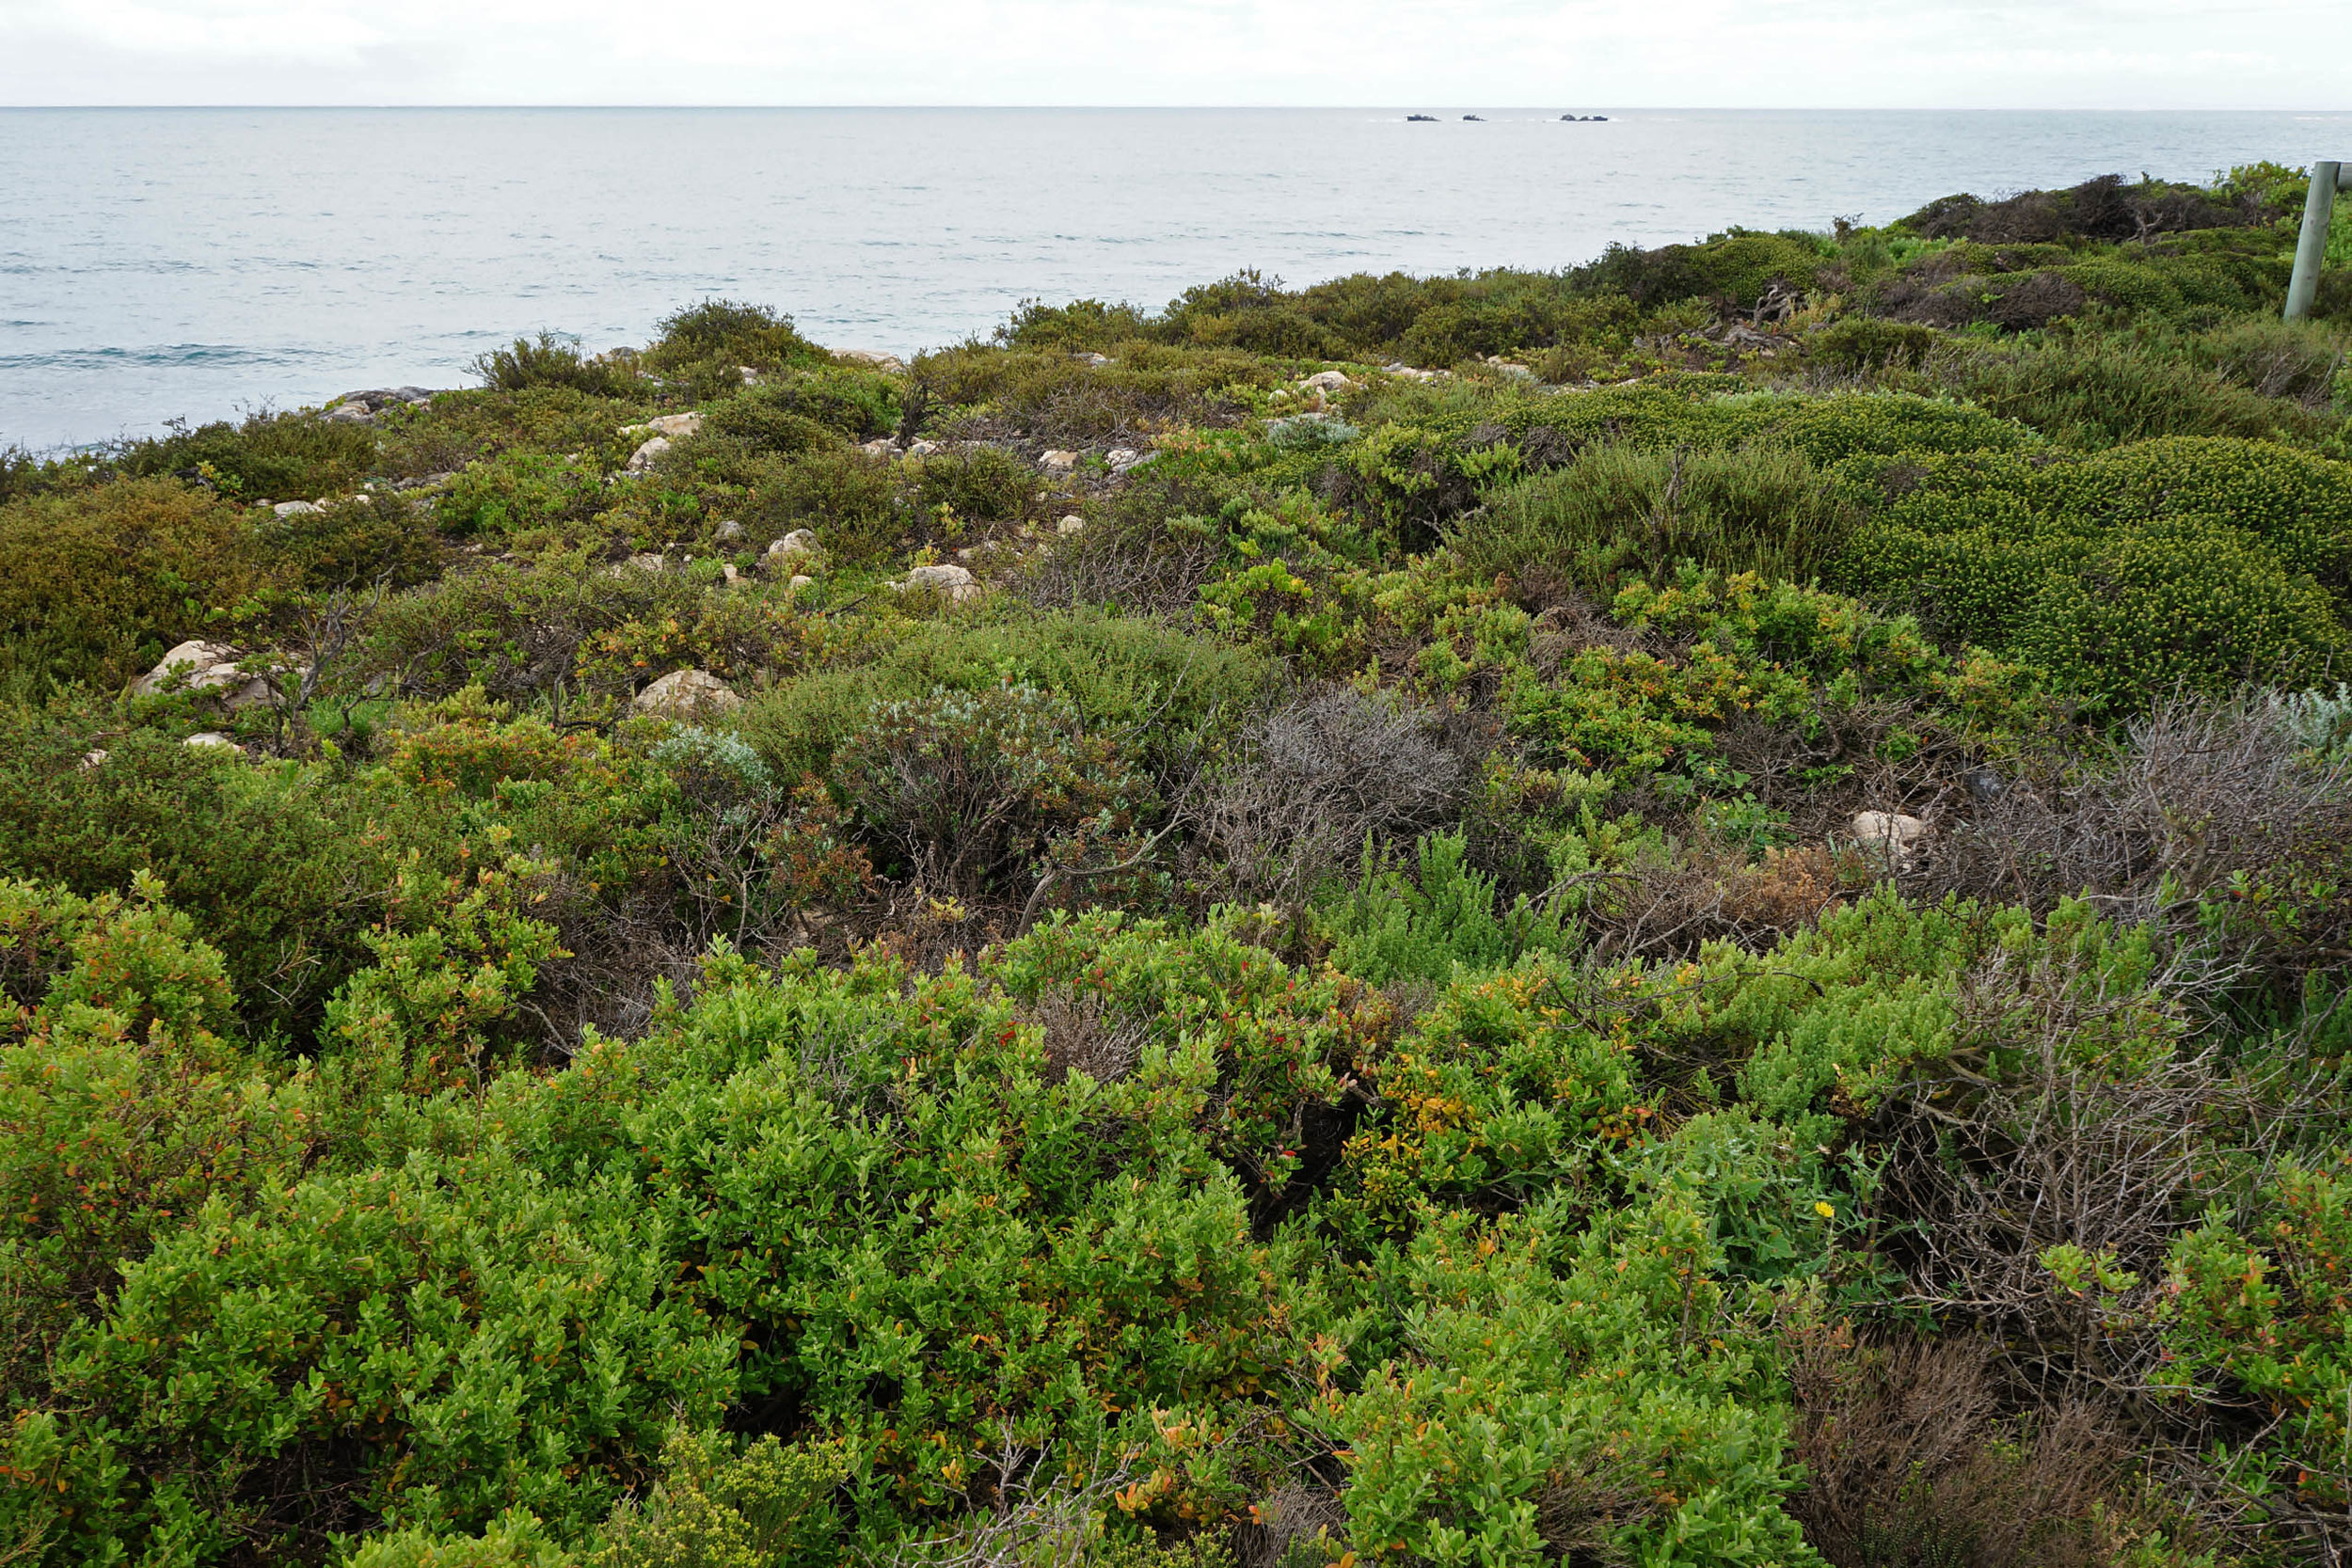
Plate 3.14: Bassendean Complexes (upland)
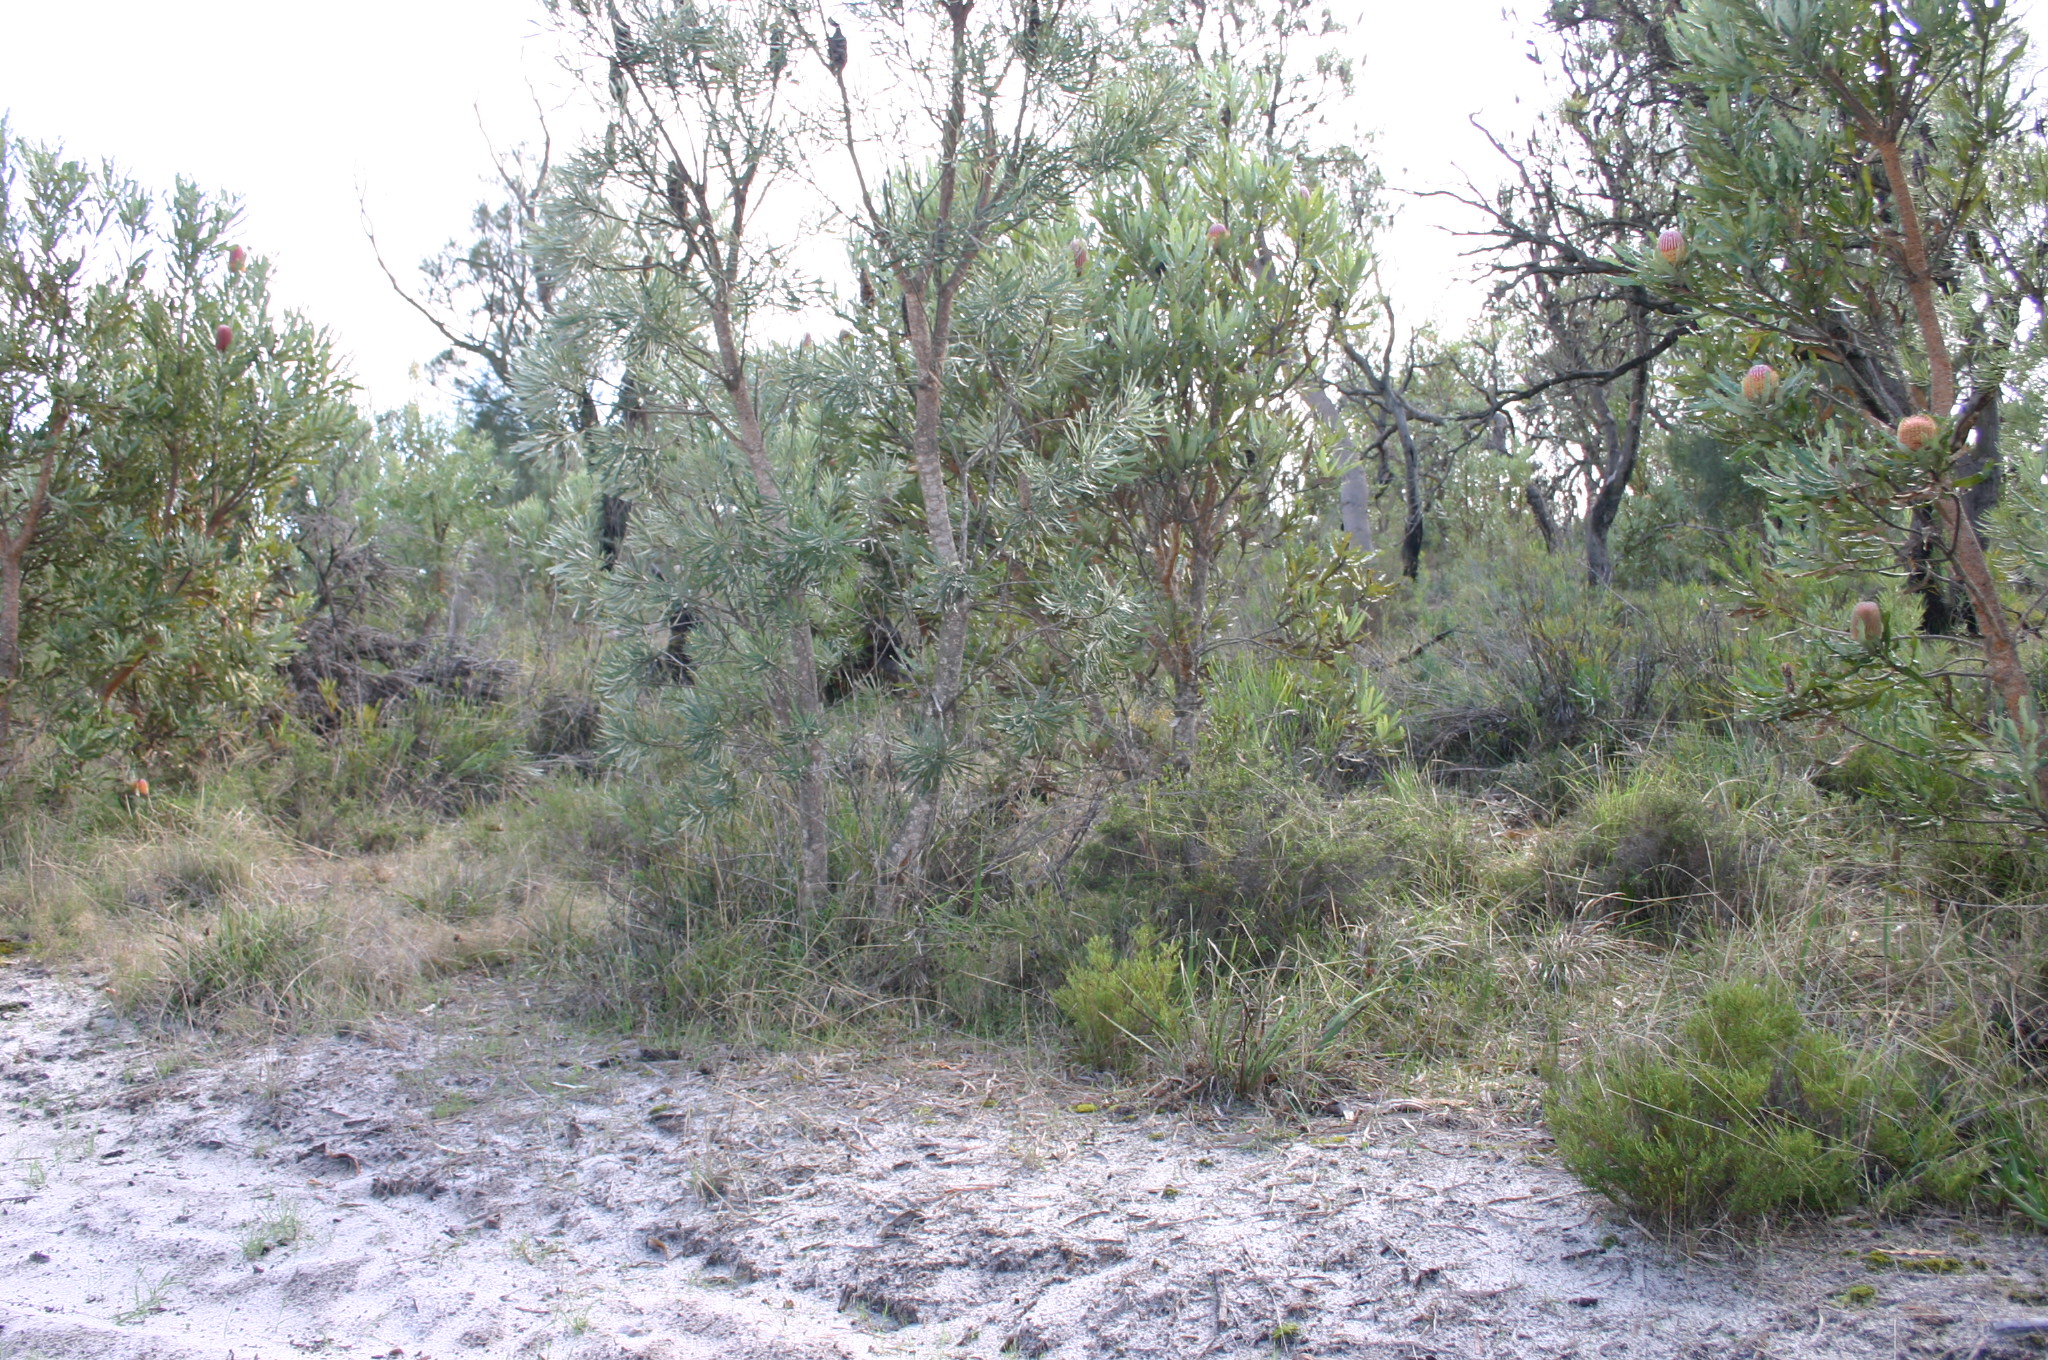
Plate 3.15: Wetland Complexes (Bibra Lake)

Plate 3.16: Pinjarra Plain - Upland and drier Complexes

Plate 3.17: Pinjarra Plain - Wetland Complexes

Plate 3.18: An example of a transition complex – Quindalup and Spearwood Karakatta
3.9 How much of each ecosystem type to conserve?
Once the ecosystem types have been agreed upon, then the % representation needs to be decided: that is, what percent of each vegetation complex needs to be protected in secure conservation reserves. In 1999, the WA Government adopted the Australian and New Zealand Environment and Conservation Council’s (ANZECC) National Framework for the Management and Monitoring of Australia’s Native Vegetation. The key aspects were
- The 30% “threshold level” for broad ecosystem types below which species loss is likely to accelerate exponentially at an ecosystem level; and
- The 10% threshold for broad ecosystem types representing “endangered”.
This was interpreted to mean that for the major urban areas, at least 10% of each the complexes need to be held in secure conservation reserves. This is based on the % prior to European settlement not what remains today. Outside the metropolitan areas the State Government policy is that at least 30% of each the complexes need to be held in secure conservation reserves.
Because of the amount of clearing of native vegetation that has taken place in the Perth region before these targets were agreed to for both agriculture and residential development (in the late 1980s), it is not possible to get the full 10% representation for some complexes, particularly those on the more fertile clay soils, for example the Guildford Complex (Pinjarra) has only 6% left uncleared with only 3% in secure conservation reserves. Table 3 list all of the complexes of the SCP and shows the percentage of that type remaining uncleared as at 2015 compared with pre European settlement, and also the percentage of that type within secure conservation reserves (compared with pre European settlement). The data in this table is from a recent report by the WA Environmental Protection Authority (EPA 2015). This EPA report is the EPA’s assessment of the environmental impacts of the Western Australia Planning Commission’s (WAPC) proposed strategic plan for Perth-Peel with a population of 3.5 million people (Western Australian Planning Commission 2015b). It’s worth noting that the EPA list two figures for percentage in secure reserves – the total amount in secure reserves and the the percent in reserves specifically set aside for conservation. The WAPC uses a broad reservation called Parks and Recreation for all of its reserves, irrespective of the actual purpose of that reserve, for example active sport or conservation. One of the recommendations of the EPA report was for the WAPC to clearly differentiate the purposes of its reserves. At the time of writing this, this issue has not been resolved and the data listed below is the total in all reserves.
Table 3.3: The State of conservation and protection of vegetation complexes of the Swan Coastal Plain Source: (EPA 2015).

As can be seen, those complexes shown in the darker shading are the most critical as the percentage remaining is below the 10% threshold and the percentage in conservation reserves is well below that. below the 10% threshold. Those complexes in the lighter threshold are the next most critical as the percentage remaining is above the 10% threshold but the percentage in conservation reserves is below the 10% threshold. In short, of the 20 vegetation complexes on the SCP, only 9 are adequately reserved, 7 are not currently adequately reserved but there are sufficient remnants outside reserves that could be reserved so as to meet the 10% threshold, but 4 complexes are not currently adequately reserved but there are insufficient remnants outside reserves that could be reserved so as to meet the 10% threshold.
3.10 The key WA biodiversity policies for Perth – Bushforever and the ‘Green Growth Plan’
Up until the mid 1990s, the key conservation policy document for the Perth area was the EPA’s the System 6 Red book (EPA 1983), which, whilst having broad Government endorsement, had no statutory basis. By the mid 1990’s it became clear than even if the Red book recommendations were implemented, the reserve system would still be inadequate. This lead the then Department of Environmental Protection (DEP) to embark on a process of updating System 6. This process soon attracted the attention of the WAPC and the then Ministry for Planning (MfP) because it became clear that any new areas to be protected would require reservation and purchase – in other words the Planning System would have to both fund the update and carry out the necessary statutory steps.
Under pressure from the planning agencies, a joint working group was established in early 1996 between DEP, the department of Conservation and Land Management (CALM) MfP and Waters and Rivers Commission (WRC) to identify the sites. The project was renamed Bushplan. After considerable discussion and disagreement amongst the departmental players, draft Bushplan was released in November 1998 (Government of Western Australia 1998). It specifically addressed the existing conservation status of the vegetation complexes of the SCP area of Perth and proposed additional sites for conservation with the aim of achieving the 10% threshold for as many complexes as possible. The draft plan caused considerable debate in the community for the following reason:
- Environmental groups believed it did not go far enough because some complexes would still be below the 10% threshold for conservation, and wetlands were not included;
- Some areas of up-zoned residential land were included which raised the ire of the development industry;
- The inclusion of these up-zoned sites added significantly to the cost of implementation;
- Areas of private rural zoned land were also included but the draft plan suggested that not all of these sites would be bought by government and that strict land use controls would need to be implemented (so called “complementary mechanisms”). Land owners saw the development potential of their land reduce over night;
- Some of the land owners affected by draft Bushplan began to clear their land; and
- Local Government saw the use of complementary mechanisms as shifting the financial burden from State Government to Local Government.
Following consideration of submissions, the renamed final Bush Forever was released in December 2000 (Western Australian Planning Commission 2000). There were some deletions from draft Bushplan and some minor inclusions but the draft plan stayed mostly in tact. Government committed $100M to implement Bush Forever, but it is likely that the full cost could well exceed that.
Bush Forever aims to
- Establish a conservation system that is, as far as is achievable, comprehensive, adequate and representative of the ecological communities of the region;
- Secure partnerships between landowners, government and the community in conservation management through government and community advice, assistance and incentives;
- Be implemented by 2010; and
- To bring greater certainty to the processes of land use planning and environmental approvals.
Bush Forever is a policy document with no real statutory power. It is simply a commitment by Government to implement. At the time, a consultative process was established with dedicated Bush Forever staff housed at DoP employed to manage implementation. The WAPC, with agreement from EPA, established a Bush Forever Intergovernmental Technical Coordination Group to oversee the implementation of Bush Forever.
There are three main types of Bush Forever sites requiring different planning solutions:
- To be reserved outright – mostly already Crown land;
- Rural – to remain rural but to have strict land use controls applied and limited land uses allowed to prevent further loss of vegetation;
- Negotiated Planning Solutions (NPS) – these are sites that are privately owned and urban zoned land. The NPS will allow for some development with the remaining (negotiated) areas set aside for conservation. These are the most contentions sites.
The implementation of Bush Forever is on-going with the the WAPC in 2014/15 spending $3.2 million to purchase four properties to include in the Reserve system for conservation (Western Australian Planning Commission 2015a).
In the end, Bush Forever is a reasonable go at resolving the conservation issues in Perth, but two significant issues remain. First, Bush Forever only applies to the SCP portion of Perth and does not include Peel or the foothills and Darling Range. Second, as noted above at it is not possible to reach the 10% conservation threshold for at least four of the SCP vegetation complexes. As noted earlier, the EPA has already signaled its concern about the implementation of Bush Forever and has urged the WAPC to address the conservation needs of the broader Perth-Peel region (EPA 2015).
In December 2015, the State Government released a new policy document that updates Bush Forever, and extends coverage to the whole Perth Peel Region. This has been called the Green Growth Plan, and, because it involves biodiversity issues at the Commonwealth government level, this will be described after the next section.
3.11 Ecological communities and individual species – Commonwealth Government
A key emerging issue in biodiversity protection are Ecological communities. These are the next level of plant associations down from complexes. They are considered to be biological assemblages in a particular type of habitat, and are particularly relevant to the Commonwealth EPBC Act (Environment Protection and Biodiversity Conservation Act 1999).
The EPBC Act came into force in 2000 and, interestingly, does not define what is the ‘environment’, but instead, prescribes certain elements of the environment that are the subject of the Act and can trigger assessment under the Act. These are defined as matters of national environmental significance, or MNES. There are nine categories of MNES:
- World heritage properties;
- National heritage places;
- Wetlands of international importance (listed under the Ramsar Convention);
- Listed threatened species and ecological communities;
- Migratory species protected under international agreements;
- Commonwealth marine areas;
- The Great Barrier Reef Marine Park;
- Nuclear actions (including uranium mines); and
- Protection of water resources from coal seam gas development and large coal mining development (added recently).
The key NES relevant here are listed threatened species and ecological communities. There are a few species that are of concern to the Commonwealth, the most notable in WA is the Carnaby's Black-Cockatoo.
‘Threatened ecological communities’ or TECs are of most concern to the Commonwealth. TECs are considered to at an extremely high risk of extinction in the immediate future because very little of that ecological community remains. Two WA examples are
- Shrublands and Woodlands of the eastern Swan Coastal Plain – these are almost the same as the Pinjarra Plain complexes; and
- Sedgelands in Holocene dune swales of the southern Swan Coastal Plain – these are the wetlands found in the swales of the Quindalup dunes, primarily in the Becher Plain south of Rockingham
The Commonwealth does not have any powers to Reserve land and so it uses its powers under the environmental assessment provisions of the EPBC Act to assess proposals that could impact key species’ habitats and clear TECs. This is discussed in more detail in the chapter on environmental impact assessment.
3.12 Green Growth Plan
For the most part, what is described below is based on the direct involvement of the author in the planning for Perth-Peel. Much of what is described has not been documented at the time this chapter was written.
In December 2015, the State Government released a report titled ‘Perth and Peel Green Growth Plan for 3.5 million (Department of the Premier and Cabinet 2015), known as the Green Growth Plan. This plan has been many years in the making, and is primarily the result of a specific assessment by the Commonwealth under the EPBC Act. As noted above, the Commonwealth had been concerned about the on-going loss of native vegetation in the Perth-Peel urban areas, especially loss of habitat of Carnaby's Black-Cockatoo and loss of certain TECs. Assessments under the EPBC Act has been case-by-case, and it became clear to all stakeholders – developers, conservation groups, State Government and the Commonwealth Government – that case-by-case assessment were leading to less that optimal environmental outcomes, and were leading to inefficient use of government resources in carrying out and responding to these assessments.
In response, in July 2011 the relevant State Ministers (Planning and Environment) agreed that the Commonwealth Minister for the Environment could carry out a strategic assessment of the urban expansion of the Perth-Peel region. This was 11 months after the finalisation of the WAPC’s spatial plan for Perth – Directions 2031 (WAPC 2010). In effect, the Commonwealth Minster would be assessing Directions 2031 and its implementation.
There were already precedents for this strategic assessment, with the Commonwealth completing strategic assessments of urban expansions in both Sydney (completed in 2012) and Melbourne (completed in 2010): however, both these assessments focused on specific areas and proposals. In Sydney, it was the growth areas in the south west and north west, totaling 27,000ha. The Melbourne assessment was of two major transport corridors, development on the fringe of the City, and certain developments within the existing urban area. The Perth-Peel assessment covered the whole of the Perth-Peel region and not just the urban areas, covering all developments within that boundary. It is the most complex and largest, in geographic area, strategic assessment ever carried out by the Commonwealth.
Directions 2031 was always seen as a
… high-level spatial framework and strategic plan for Perth and Peel sets the broad framework to 2031 and establishes a vision for a population of 3.5 million people (WAPC 2015) P13
The more detailed land uses decisions that would deliver the 2031 vision - for example where new development are to be located – was to be the subject of later more detailed planning. A draft more detailed strategic plan was released in May 2015 (WAPC 2015) along with detailed land uses plans for all the urban corridors, including the existing central region of Perth – this was called the Framework. Instead of using a specific timeframe, it is based on a specific projected population for Perth-Peel – 3.5 million people. The Framework was developed at the same time as the Commonwealth assessment documents were being prepared, and the Framework was heavily influenced by this process.
The Green Growth Plan is the State’s response to the Commonwealth assessment, and is, in effect, the environmental impact statement (EIS) document (see a later chapter in EIA). At the time of writing, this document (along with the Framework) were out for pubic comment, and the Commonwealth Minister has yet to assess it.
As well as the Commonwealth assessment, the WA EPA is also assessing the broader environmental implications of the framework, and in July 2015 released it initial assessment of the framework (EPA 2015).
Both the Green Growth Plan and the EPA initial assessment focus heavily on biodiversity protection, with the key measure proposed being:
- Adding 170,000ha of bushland into conservation reserves, with will partially offset the loss of bushland cleared for development;
- Reserving most of the outstanding Bush Forever sites;
- Protecting the remaining high value wetlands not already protected – so called Conservation category Wetlands (see chapter 4);
- Implementing a new management strategy to reduce nutrient run-off into the Swan Canning and Peel Harvey estuaries;
- Implementing a program to protect Carnaby’s cockatoo, including
- Of the 170,000 new conservation reserves, at least 116,000 hectares will contain Carnaby’s cockatoo habitat,
- Re-creating Carnaby’s cockatoo habitat in strategic locations, including replaced 5000 ha of pine (being thinned), and
- Research and monitoring program
- Introducing specific programs to address other species considered to be MNES.
As can be seen, the Green Growth Plan is a significant conservation program with a specific emphasis on biodiversity protection.
3.12 Controlling the clearing of native vegetation in WA
3.12.1 History
Legislation to directly control the clearing of native vegetation in WA came into force in 2004, but up until that time, the controls on clearing were very weak.
There are probably three key players in the history of protection of Native vegetation in WA: the Landcare movement, the EPA and the Commissioner of Soils and Land Conservation.
Whilst the formal Landcare movement emerged in 1986 with the announcement by the then Commonwealth Government of the start of the decade of Landcare (Curtis, Britton and Sobels 1999), community action to protect and better manage agricultural land had been happening since at least the 1960s. The chief concern at the time was the increasing salinity, both on the land leading to loss of productive land, and in the waterways, especially the Collie River. During the 1970s, concern about salinization of waterways in the SW lead to a ban on clearing being declared in the Wellington Catchment by the then Minister for Public Works, and in 1978, the Government proclaimed legislation extending clearing bans to the Mundaring, Denmark and Kent catchments (Read 1998).
At this time, other than that specific legislation, the only controls over the clearing of native vegetation was through the Soil and Land Conservation Act 1845. This Act allowed the Commissioner of Soils and Land Conservation to prevent any clearing of land where, if his/her opinion, land degradation could occur. To administer this part of the Act, the Department of Agriculture established a procedure where a land owner wanting to clear native vegetation had to submit a Notice of Intent to Clear, which was assessed by the Commissioner of Soils and Land Conservation. In practice, land degradation was interpreted narrowly as being about threat of soil erosion or increased salinity. Broader issues including biodiversity were not a consideration.
The EPA’s interest in the protection of native vegetation, especially in the agricultural areas, seriously began in the late 1980s and early 1990s. In 1992 the EPA decided to develop an EPP to
… provide clear sets of rules for conditions under which vegetation in various parts of the South~West could be cleared, according to its extent and condition. (EPA 1993a, , 22)
It noted with concern that many rural local government areas had less than 20% native vegetation cover and some as low as 10%.
An EPP was never published and it is unclear how much progress was made within the EPA in developing one. Notwithstanding, this further clearing of native vegetation in the agricultural area was seen by the EPA as having a significant impact on the environment, and proposals to clear triggered assessment by the EPA. The EPA published its first assessment report on a proposal to clear native vegetation in the agriculture area in 1993 (EPA 1993b). Whilst the EPA did not specifically recommend against the proposal, it recommended that the Government should purchase the land to prevent it being cleared. It also noted the inequity issue where some land owners should be prevented from further clearing their land whereas other land owners had already completely cleared their land.
It became clear to the EPA that the Notice of Intent to Clear process of the Commissioner of Soils and Land Conservation was unable to refuse applications where the only issue was the significance of the vegetation. Between 1997 and 2003 the EPA assessed a further 17 clearing proposals, further highlighting the lack of proper policy and an appropriate process to deal with the issue.
A related problem was how to deal with land owners who cleared their land without an approval, and one incident in particular demonstrated the gap in the legislation. In 1990 Palos Verdes Estates Pty Ltd, the owner of land on the Nullaki Peninsula near Albany, had applied to construct a road through a seven kilometre portion of native bush on Crown land that was between the company’s property and the nearest main road. When an approval wasn’t granted, the owner choose to clear the bush land anyway and construct the road. The EPA decided that the only section of the EP Act that could apply in this case was Part 5 (Pollution Prevention) and so charged the owner with causing pollution. The case was thrown out by the Supreme Count of WA, determining that clearing of vegetation could not be considered pollution.
To summarise the situation in the early 2000s in one single statement is would be that the existing legislative framework was inadequate to deal with the biodiversity and broader socioeconomic implications of continued clearing in the Agricultural region. The 2004 Amendments to the EP Act and the separate 2004 Regulations related to Clearing of Native Vegetation were a response to this.
3.12.2 Native Vegetation clearing permit process in WA
The changes to Part V of the Environmental Protection Act 1986 makes clearing of native vegetation without a permit an offence. This is supported by the Environmental Protection (Clearing of Native Vegetation) Regulations 2004. Most clearing now requires a permit, and there is no expectation that an approval will be granted.
The meaning of ‘clearing’ under the Act is very broad (S51A of the EP Act) and covers:
- Direct action - killing, removal ring barking nor other “substantial” damage to native vegetation; or
- Indirect actions – draining wetlands, flooding dry land vegetation, burning and allowing stock to graze on native vegetation.
There are exemptions where a permit is not required, including:
- Clearing required as part of subdivision approval (assumes EPA consideration of the Scheme or actual subdivision);
- For building envelopes;
- For fire reduction;
- Fencing and firebreaks;
- Certain tracks; and
- Re-generation less that is less than 10 years old.
Section 51A also requires that ‘clearing principles’ be established against which applications to clear native vegetation are to be assessed. These are set out in Schedule 5 of the EP Act, but in summary are as follows.
There is a general presumption against clearing of vegetation that:
- Is highly diverse;
- Is a significant part of a habitat of a native fauna species;
- Is essential for the continuation of a declared rare species of flora;
- Is a threatened ecological community;
- Is a significant remnant in a region that has a high degree of clearing already;
- Is associated with a wetland or watercourse;
- If cleared, would lead to land degradation;
- If cleared, could impact on an adjacent conservation area;
- If cleared, could lead to loss of water quality in a watercourse or wetland; and/or
- If cleared, could lead to significant flooding or increase flooding.
Section 51B allows for certain native vegetation to be declared “Environmentally sensitive areas”, which means that there is a general presumption against their clearing, and they may be excluded from some of the exemptions. These Environmentally sensitive areas are set out in the Regulations, and include the following (note - there are some overlaps with the principles above):
- A World Heritage area;
- Area registered on the Register of the National Estate;
- A defined wetland and its 50m buffer;
- Vegetation within 50 m of rare flora;
- A threatened ecological community;
- A Bush Forever site; and
- Vegetation within the defined areas of any Environmental Protection Policy where native vegetation is central to the policy.
Notwithstanding this, clearing of an Environmentally sensitive areas or clearing inconsistent with the principles can be granted where “in the CEO’s opinion there is a good reason for doing so.” (Section 51O(3)). In these cases, the reasons for that decision need to be published. Generally, this is interpreted to mean that existing government policies need to be taken in to account as well broader socioeconomic benefits. For example, a proposal that would involve clearing vegetation that would normally be refused for biodiversity reasons can be allowed where it is part of a government agreed policy (e.g. a planned for road or water treatment plant); or modification to a dangerous section of a road where public safety would be as risk should the roadworks not proceed. The approvals normally have a condition set requiring a substantial offset.
The Department of Environmental regulation (DER), not the EPA, handles and assesses permit applications and sets conditions where approved, which can include offsets for the loss of vegetation. Offsetting is covered in detail in the next and last section.
3.13 Biodiversity offsets
A recent development in the biodiversity debate has been the emergence of biodiversity offsets as a policy response to the on-going clearing of native vegetation. Environmental offsets are indirect compensatory measures used as mitigation for the unavoidable environmental impacts of development proposals. They can include rehabilitating already cleared land as compensation for clearing remnant vegetation, building new wetlands to replace wetlands to be filled to allow development, and planting trees to absorb carbon dioxide as an offset to carbon dioxide produced by commercial airlines. Offsets have also been called compensatory habitats, ecological compensation (eco-compensation), environmental compensation and mitigation banking. Biodiversity offsets – offsets involving native vegetation – are the most common type of environmental offset.
Biodiversity offsets have been in use in many countries, mostly developed, for over 20 years most notably in the United States, Canada, China, United Kingdom and in other European nations. Biodiversity offsets have recently been introduced in several states of Australia, and the WA EPA has recently adopted an offsets policy to apply to certain new proposals undergoing environmental impact assessment (EIA) (EPA 2006, 2008). This has now become a whole of government policy (Government of Western Australia 2011).
Biodiversity offsets have evolved from the practice of ecological restoration, which can be described as a process “to restore natural, historic, or prehistoric ecological communities and eco- systems that preceded the disturbance caused by human activities” (Choi 2004, :77). Ecological restoration is usually carried out separately from the development approvals process. It is driven, in part, at the local community level to address and repair widespread land degradation as a result of the cumulative impacts of development over many decades. Community based movements like Landcare in Australia in the 1980s and 1990s were successful in restoring degraded land back to agriculture production as well as revegetating large areas of cleared land.
The key principle supporting the use of biodiversity offsets is the notion of ‘no net loss’ (NNL). It has been a central element of the nature conservation strategies in both the USA and Canada for well over ten years (Harper and Quigley 2005), and its wide-spread application is largely attributed to George Bush’s 1988 presidential campaign where he announced a no net loss of wetlands policy. A useful definition of NNL is:
… a principle by which countries, agencies, and governments strive to balance unavoidable habitat, environmental and resource losses with replacement of those items on a project-by-project basis so that further reductions to resources may be prevented. (Appledorn, Ankersen and Ruppert Undated, :1)
In practice, NNL is implemented as a ‘net gain’ policy, and there are three key elements to NNL:
- The size of the replacement habitat should be at least as large as the area of habitat that is lost;
- ‘Compensation ratios’ of greater than one should be considered; and
- The values of what are lost should be replaced.
Compensation ratios are “multipliers that show the relationship between the amounts of loss and gain” (Minns 2006, :1172), and is the area (size) ratio between the area replaced compared to area lost (area of replacement /area lost). Generally, this ratio is greater than one and can be as high as 10.
Minns (2006) argues that there are three reasons why this ratio should be greater than one: replacement, uncertainty and timing. Replacement refers to the relative productivity values of the two habitats, where it is acknowledged that it is almost impossible to get a like-for-like replacement and that the replaced habitat may well be less productive than the one lost. A larger area is required to make up for the possible loss of productivity. Uncertainty is inherent in the replacement process where the final outcome of the new habitat has elements of unpredictability, and the habitat is more likely to be different than that planned. In recognition of this uncertainty, a larger area of habitat is required as replacement. Timing relates to the length of time the replacement habitat needs to reach it full productive capacity. There will be a period of time between when clearing occurs and the replaced habitat reaches maturity resulting in the net productivity being reduced. To make up for this loss of productivity, the size of the replaced habitat should be larger than the area lost.
In practice, NNL has proved difficult to both implement and monitor. As well, there is considerable debate as to whether securing and reserving an already uncleared area of land in private land can actually be considered an offset for clearing of native vegetation.
One of the key criticism of biodiversity offsetting is that it is often case-by-case and doesn’t necessarily lead to the best environmental gains: for example a proponent will be required to find an offset quickly and simple obtain the best available at that time. In places like the USA and in NSW there is now an active bio-banking and habitat trading schemes in place. In the USA, proponents identify and purchase potential high quality offsets as they become available in anticipation of the need for these in later EIAs. In NSW, the bio-banking scheme is managed through a Trust fund, where a developer contributes funds to the Trust and the Trust fund identifies and secures the offset. Here, government conservation agencies have already identified key natural areas that should be added to the conservation estate, and purchase these areas as funds become available through the EIA offsets fund.
In WA biodiversity offsets are used routinely in approvals under the Native Clearing Regulations, especially where approval to clear ‘environmentally sensitive areas’ is granted. DER routinely applies compensation ratios well over 1:1. Sections 51H and I of Part V of the EP Act specifically allow for offsets as part of granting an approval to clear native vegetation. The EPA now routinely uses of offsets as part assessment of large proposal even though there is no provision in the assessment part of the EP Act to allow for offsets. As a result, its use has been outside the formal and legal framework of Condition setting. A key problem is that conditions set under Part IV of the EP Act can only apply to the project area: this means that it is not legally possible to set an offset to require rehabilitating cleared land outside the project area. There is now a whole of WA Government approach to offsets (Government of Western Australia 2011) which strengthened the EPA’s position.
The key aspects of the policy are as follows:
- The policy is not a legally binding document;
- Two types of offsets can be applied -
- Direct which can be on-ground improvements or rehabilitation of natural habitats, acquisition of important habitats for inclusion into the conservation estate. This can occur either within the project area or elsewhere.
- Indirect (formally contributory) – these aren’t specific on-ground works but include research projects related to the species or habitat impacts by the proposal, funding community conservation works and funding management and protection measures for the existing conservation estate. These works can be directly funded by the proponent or the proponent can provide funds to a third party to carry out the works, which includes funding agencies like DPaW
- Offsets should only be considered after avoid, reduce options have been exhausted and significant residual impacts remain;
- Notwithstanding this, offsets should be raised early on in the assessment process for greater transparency;
- It is not a NNL policy and only applies to significant residual environmental impacts;
- Like-like for like offsets are preferred, but it is acknowledged that this will not always be possible;
- Adaptive management is important to deal with the uncertainly of the outcomes of some offsets – how effective they will be – and the time lag issue (see above);
- A strategic approach is preferred that is both enforceable and addresses the broader strategic aims of the State;
- Detailed guidelines will be developed; and
- Offset register has been established – this is primarily just a data base of offsets set to-date. Its is called the “Government of Western Australia Environmental Offsets Register” - https://offsetsregister.wa.gov.au/public/home/ .
The use of biodiversity offsets continues to be controversial, and in early 2014 the Australian Senate referred the use of offsets to the its Environment and Communications References Committee, which reported in June that year (Senate Environment and Communications References Committee, 2014). The following quotes from the submissions made to the committee reflect the concerns, especially of Green and community groups:
The current practice of biodiversity offsets, while well intentioned, is poorly designed and implemented resulting in a ‘green-wash’ for the approval of highly destructive projects. The BOP does not prevent the ongoing loss of our unique Australian biodiversity. (Greenpeace).
Let me be clear from the outset; the AKF is totally opposed to the concept of environmental offsets. They sanitise the destruction of our natural capital. Given the current state of Koala populations throughout Australia, there can be no role for offsets in Koala protection. (Australian Koala Foundation)
… the increasing use of offsets as a way of replacing efforts to ‘avoid’ or ‘mitigate’ in the application/approval process, means greater loss of biodiversity at a time when Australia’s abysmal record in biodiversity loss is set to increase with the inevitable impacts of government-assisted climate change. (North Queensland Conservation Council)
As noted above, the use of offsets is relatively new and there are few studies on their effectiveness. Whilst the use of offsets, especially when compensation ratios of greater than 1 are applied, have the potential to reverse the decline in extent of coverage of native vegetation, their effectiveness in addressing biodiversity loss is quite another matter. Appropriate monitoring is needed to test the biodiversity effectiveness matter.
3.14 References
Appledorn, Brenda, Thomas T. Ankersen, and Thomas Ruppert. Undated. Regulatory Incentives and Criteria to Preserve Recreational and Working Waterfronts: A Policy Menu for Florida’s Waterfront Communities. Florida. http://www.law.ufl.edu/conservation/waterways/waterfronts/pdf/no_net_loss.pdf.
Australian Government. 2009. Australia’s Fourth National Report to the United Nations Convention on Biological Diversity. Canberra.
Beatley, Timothy. 2000. "Preserving Biodiversity: Challenges for Planners." Journal of the American Planning Association 66 (1): 5-20.
Choi, Y.D. 2004. "Theories for Ecological Restoration in Changing Environment: Toward 'Futuristic' Restoration." Ecological Research 19 (1): 75-81.
Churchward, H. M., and W. M. McArthur. 1980. "Landforms and Soils of the Darling System, Western Australia." In Atlas of Natural Resources Darling System Western Australia, ed. M. J. Mulcahy, 25-36. Perth, Western Australia: Department of Conservation and Environment.
Curtis, Allan, Andrew Britton, and Jonathan Sobels. 1999. "Landcare Networks in Australia: State-Sponsored Participation through Local Organizations." Journal of Environmental Planning and Management 42 (1): 5-21.
Department of Conservation and Land Management. 2004. Towards a Biodiversity Conservation Strategy for Western Australia: Discussion Paper. Perth, Western Australia.
Department of Environment and Conservation. 1980. Atlas of the Natural Resources Darling System Western Australia: Explanatory Text. Perth, Western Australia: University of Western Australia Press. http://www.dec.wa.gov.au/content/view/1416/1622/.
Department of the Premier and Cabinet. 2015. Summary: Perth and Peel Green Growth Plan for 3.5 Million. Perth, Western Australia.
EPA. 1983. Conservation Reserves for Western Australia: The Darling System - System 6 Part Ii, Recommendations for Specific Localities. Perth, Western Australia.
———. 1993a. Annual Report 1992-93. Perth, Western Australia.
———. 1993b. Clearing of 179ha of Land for Agriculture - Williams Location 13895 North Kukerin. Matthew King. Report and Recommendation of the Environmental Protection Authority. . Perth Western Australia.
———. 2006. Environmental Offsets. Position Statement No 9. Perth, Western Australia.
———. 2008. Guidance for the Assessment of Environmental Factors (in Accordance with the Environmental Protection Act 1986): Environmental Offsets - Biodiversity. No 19 Perth, Western Australia.
———. 2015. Perth and Peel @ 3.5 Million: Environmental Impacts, Risks and Remedies. Interim Strategic Advice of the Environmental Protection Authority to the Minister for Environment under Section 16(E) of the Environmental Protection Act 1986. Perth, Western Australia.
Government of Western Australia. 1998. Perth's Bushplan. Perth, Western Australia.
———. 2011. Wa Environmental Offsets Policy. Perth, Western Australia.
Grano, Daniel A. 2002. "Spiritual-Material Identification in the Deep Ecology Movement." The Southern Communication Journal 68 (1): 27-39.
Harper, D. J. , and J. T. Quigley. 2005. "No Net Loss of Fish Habitat: A Review and Analysis of Habitat Compensation in Canada." Environmental Management 36(3): 343-355.
Hawken, Paul , Amory B. Lovins, and L. HunterLovins. 1999. Natural Capitalism: The Next Industrial Revolution. London: Earthscan.
Heddle, E. M., O. W. Loneragan, and J. J. Havell. 1980. "Vegetation of the Darling System." In Atlas of Natural Resources, Darling System, Western Australia. Perth, Western Australia: Department of Conservation and Environment.
Koshin, Jillian. 2011. "Shifting Visions: Developmentalism and Environmentalism in Australian History." Australian Studies 3: 1-21.
Minns, Charles K. 2006. "Compensation Ratios Needed to Offset Timing Effects of Losses and Gains and Achieve No Net Loss of Productive Capacity of Fish Habitat." Canadian Journal of Fisheries and Aquatic Sciences 63 (5): 1172-1182.
National Biodiversity Strategy Review Task Group. 2009. Australia’s Biodiversity Conservation Strategy 2010–2020: Consultation Draft. Canberra.
Natural Resource Management Ministerial Council. 2010. Australia’s Biodiversity Conservation Strategy 2010–2030. Canberra. http://www.environment.gov.au/biodiversity/publications/strategy-2010-30/pubs/biodiversity-strategy-2010.pdf.
Priskin, Julianna. 2001. "Assessment of Natural Resources for Nature-Based Tourism: The Case of the Central Coast Region of Western Australia." Tourism Management 22 (6): 637-648.
Read, Viv. 1998. Salinity in Western Australia a Situation Statement.
Register, Richard. 2006. Ecocities: Rebuilding Cities in Balance with Nature. Gabriola Island, Canada: New Society Publishers.
Secretariat of the Convention on Biological Diversity. 2010. Global Biodiversity Outlook 3. Montréal, Quebec, Canada.
Toursim Research Australia. 2009. Snapshots 2009 Nature Tourism in Australia. Edited by Department of Resources Australian Government, Energy and Tourism. Canberra.
WAPC. 2010. Directions 2031 and Beyond: Metropolitan Planning Beyond the Horizon. Perth, Western Australia.
———. 2015. Draft Perth and Peel@3.5million. Perth, Western Australia.
Western Australian Planning Commission. 2000. Bush Forever: Keeping the Bush in the City. Perth, Western Australia. http://www.planning.wa.gov.au/publications/5911.asp.
———. 2015a. 2014/15 Annual Report. Perth, Western Australia.
———. 2015b. Draft Perth and Peel@3.5million. Perth, Western Australia.
WWF, Zoological Society of London, and Global Footprint Network. 2010. Living Planet Report 2010: Biodiversity, Biocapacity and Development. Gland, Switzerland.
Yıldırım, Tanay B. , AkTutku, and Olmez. Zuhal. 2008. "Assessment of the Natural-Cultural Resources in Canakkale for Nature-Based Tourism." Environment, Development and Sustainability 10 (6): 871-881.
Dr Garry Middle, October 30, 2015
Email: garrymiddle@vision-environment.com